Debugging JavaScript: The "debugger" Keyword
The debugger keyword in JavaScript allows you to pause the execution of your code to inspect its current state in a debugger tool (such as the browser's developer tools).
It's a severely underused tool that will save you hours of console.logging.
This article will walk you through the basics of using it.
Understand the Basics
The debugger keyword, when executed, will halt the code execution.
This only happens if you have the developer tools open in your browser.
To open your developer tools, press F12 or right-click anywhere on a webpage and select "Inspect" or "Inspect Element".
Then to apply debugger is easy. Just add the keyword to your code somewhere you'd like it to stop.
Example:
function myFunction() {
  let x = 5;
  let y = 10;
  debugger;  // This will pause the code here
  let result = x + y;
  console.log(result);
}
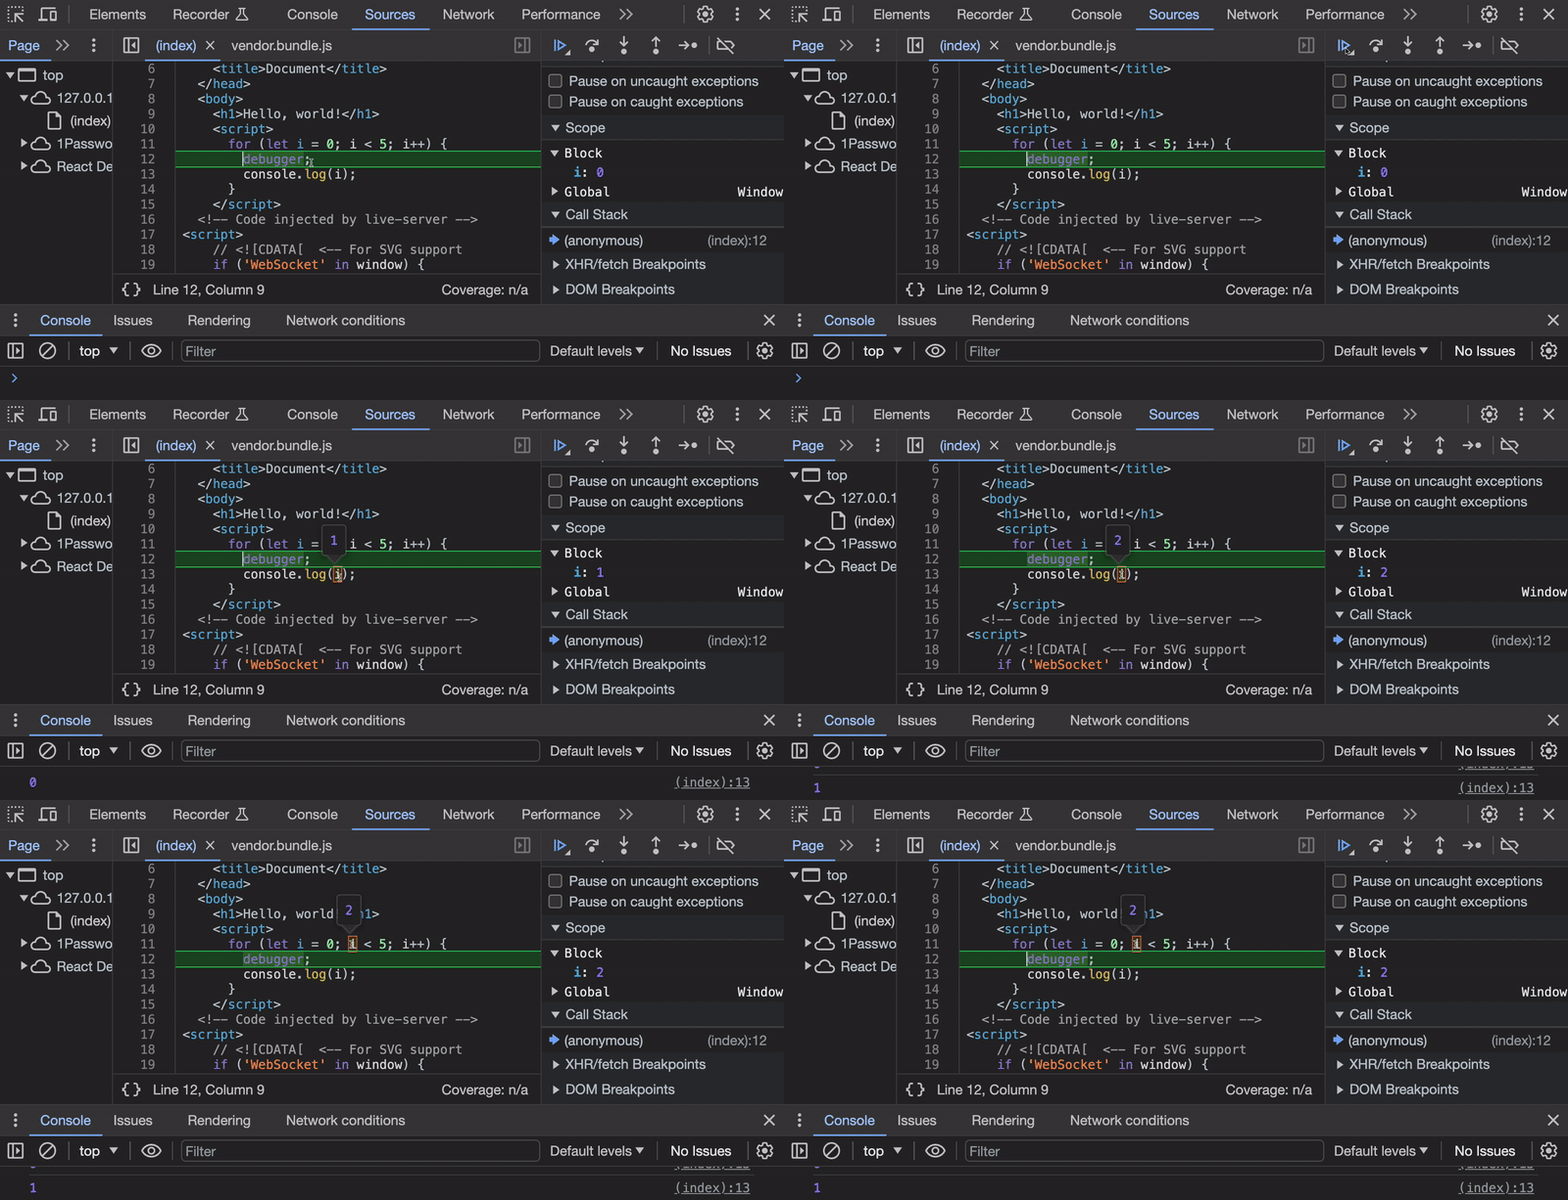
You can then hover over the values in the debugger to see what the current state of your application is.
You can then click "Resume execution" (the triangle icon on the top right of your dev tools) to continue to resume your script.
Here's a little gif showing it in action:

Let's look at a few more example use cases so you can see how handy this is:
Using the Debugger in a Function
Imagine you have a function, and you want to inspect its behavior.
function addTwoNumbers(a, b) {
  debugger;
  return a + b;
}
When you call this function, and if your browser's developer tools are open, the execution will pause at the debugger line. You can then inspect the values of a and b, or step through the code line by line.
Debugging Loops
Loops can sometimes have unexpected behaviors. Using the debugger keyword inside a loop can help you understand what's going on.
for(let i = 0; i < 5; i++) {
  debugger;
  console.log(i);
}
Each iteration will pause at the debugger, allowing you to check the value of i.
Debugging Event Handlers
Let's say you have a button, and you want to inspect the event handler when the button is clicked.
HTML:
<button id="myButton">Click Me</button>
JavaScript:
document.getElementById('myButton').addEventListener('click', function() {
  debugger;
  alert('Button was clicked!');
});
When you click the button, the code will pause at the debugger line before showing the alert.
Tip: Developer Tools with Debugger
You can even set debuggers straight from the dev tools!
Here's how:
Opening Developer Tools: Press
F12or right-click anywhere on a webpage and select "Inspect" or "Inspect Element".Source Tab: Go to the "Sources" tab in the developer tools. Here you can see your code and set breakpoints.
Resume Script Execution: After your code halts at the
debugger, click the play/resume button (usually a triangle icon) in the developer tools to continue code execution.Inspect Variables: When paused, hover over variables in your code to see their current values or look in the "Scope" section of the debugger.
Step Through Code: Use the "Step Over", "Step Into", and "Step Out" buttons in the developer tools to navigate through your code one line at a time.
One Last Tip: Always remember to remove the debugger statements from your code before deploying it to a live environment!
